
When you create visual art, like illustration, for example, your own and other people’s eyes are the most severe judges of your works. That’s why it is so important to always make sure that the quality of the materials you use won’t become an obstacle on your way to getting the result you’re striving for.
In the case of digital illustration, the way the idea, the dynamics and the style of your work is perceived depends hugely on the quality of the monitor you create it on and the quality of the monitors viewers see it on.
Still, I often get asked what the point of using a monitor with good color reproduction is if most of the viewers see your works on monitors with bad color reproduction. As I was thinking about what to reply to questions like that one, I came up with a little theory. Let’s try to look into the matter, and math will help us with that.
Check our Illustration for Animation course.
Ready for Some Good Old Algebra?
Imagine some X-axis, which stands for a property of a monitor. Let’s mark off point 0 on the axis and agree that only the best monitors have 0 in this property. Next, let’s mark off a neighbourhood of the point 0: –Q, +Q. This segment will include the entire range of values of this property for existing monitors.
Next, let’s draw the Y-axis perpendicular to the X-axis; it will stand for the number of monitors. Now, let’s assume that the number of monitors is expressed through the normal distribution function, or Gaussian distribution. Next, let’s get rid of the unnecessary details.
You may wonder why the function reaches its peak at point 0, while there are fewer good monitors than bad ones. Let’s figure it out.
Near point 0, mark off a neighbourhood: –a, +a. This value characterizes a margin of quality error that we can allow in the monitor assessment. Thus, the number of good monitors will be equal to the integral from -a to +a of the F(x) function. This integral will be equal to the square of the figure G.
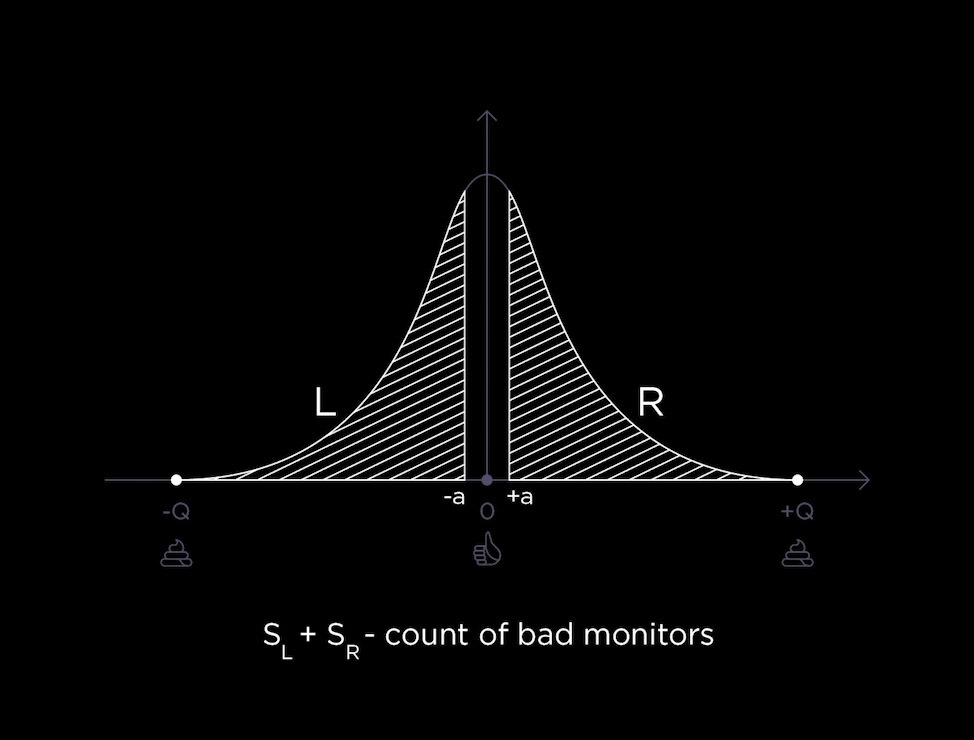
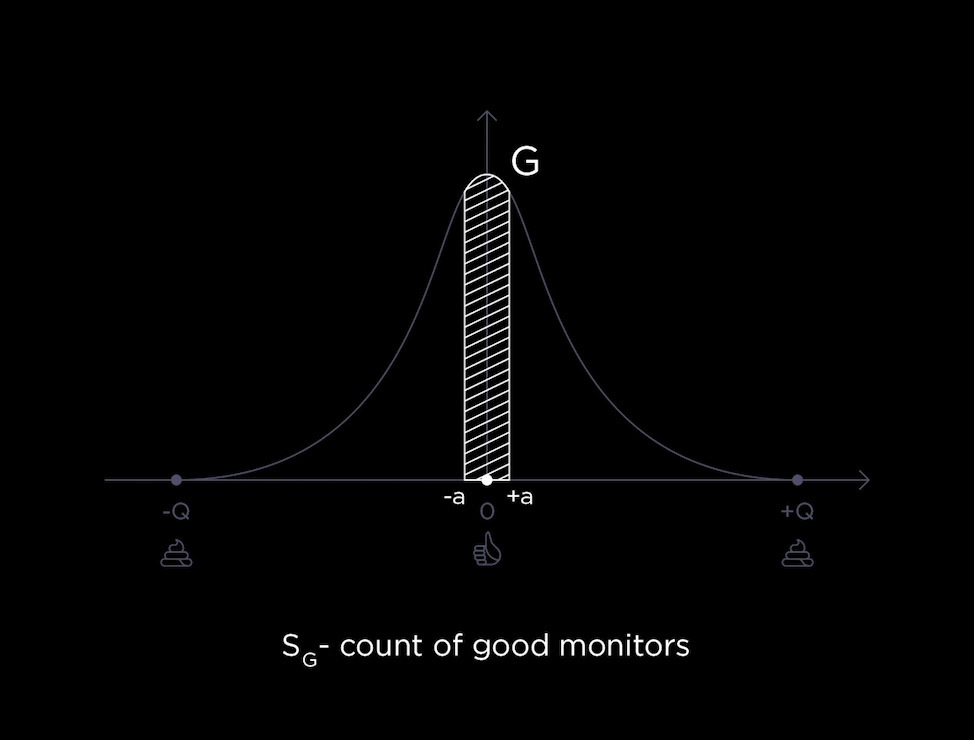
As a result, the square of the figure G is the number of good monitors, while the number of bad monitors is equal to the square of the figures L and R. And it is easy to conclude that the sum of the squares of the figures L and R is bigger than the square of the figure G.
SL + SR > SG
Count of bad monitors > Count of good monitors
Thus, we find that the number of bad monitors is greater than the number of good monitors. So, why is it better to use monitors with good color reproduction, even if most of the audience has bad monitors? There are two reasons for this, let’s analyze them.
Reason 1:
The Better Your Monitor Is, the More Monitors Will Reproduce Your Illustration Correctly
Let’s consider two cases: when you use an ideal monitor with the notional property value equal to 0, and an average monitor with the notional property value equal to A; A is not 0 in this case. Let’s mark off some neighbourhoods –a, +a for both points that will stand for an acceptable margin of error of color reproduction on other monitors.
As a result, we’ve got two figures – G and W. The square of the figure G is the number of monitors on which our illustration will be displayed correctly provided that we work on an ideal monitor with the property value of 0. And the square of the figure W also defines this number, only if we worked on a monitor with the notional property value equal to A, which is not equal to zero. As you can see, the square of the figure G is larger than that of the figure W, meaning the better monitor we use, the more monitors in the world will reproduce our illustration correctly.
Reason 2:
The Better Your Monitor Is, the Lesser the Difference in Displaying Your Works on the Viewer’s Monitor Will Be
Let’s imagine that you use an ideal monitor. That is, the value of the notional property of your monitor is 0, while the viewer who is looking at your illustration uses not an ideal one.
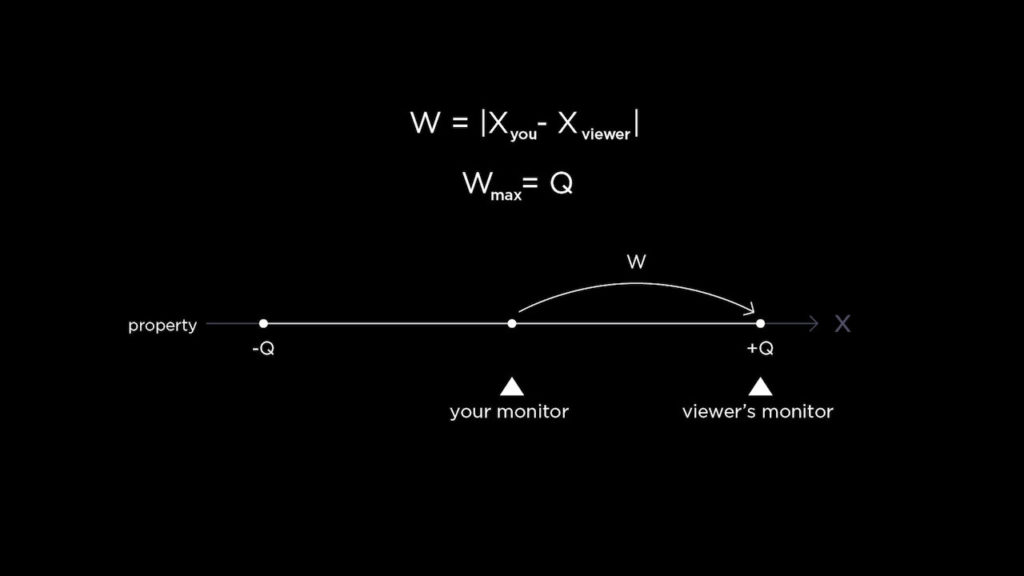
Thus, W is the difference in reproducing the illustration on your and the viewer’s monitors. So, it is easy to conclude that the maximum value of W will be equal to Q.
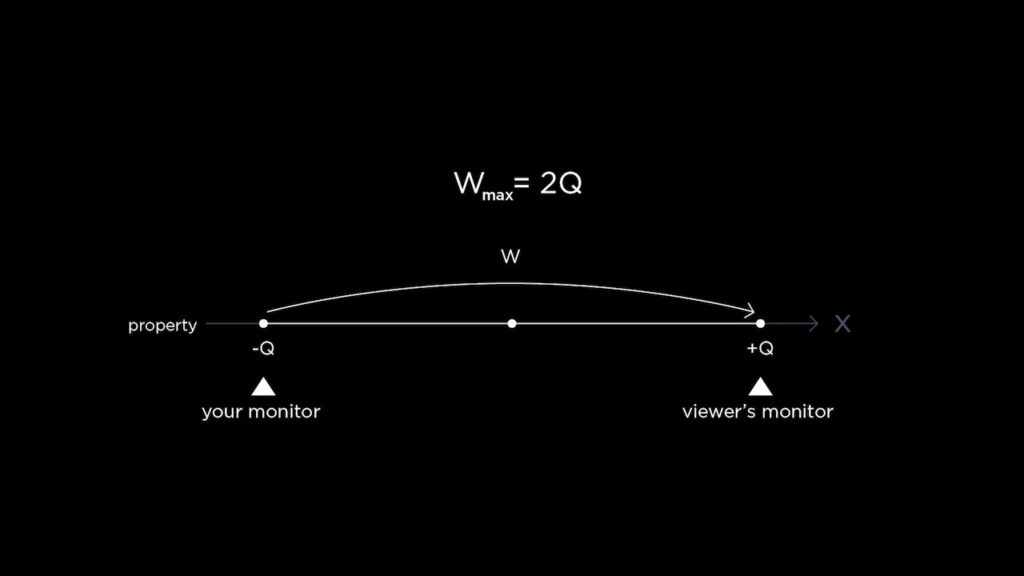
But what if the value of the notional property of your monitor isn’t also equal to 0, like the viewer’s monitor? Then the maximum value of W will be 2 times Q. As a result, the better monitor you use, the less likely there will be a large difference in displaying illustrations on your and the viewer’s monitors.
All in all, after some simple logical conclusions, we have determined that it is better to use high-quality monitors, even if most of the viewers use low-quality ones.
Is There a Way to Use This Information?
It is self-evident that there are less good monitors than bad monitors, and that there is a significant difference in their prices. Still, the fact that the quality of your own monitor can affect the way your work is perceived on someone else’s, isn’t as plain to see. At least now you have a scientific proof of that, and can present it to your boss or creative director in order to make your workplace more comfortable and the result of your work more impressive.
Algebra doesn’t lie!

Would you like to know what else an aspiring illustrator needs to know when starting a journey into the industry? Check out the article on How to Become an Illustration on a Budget Without Spending a Fortune.
Want to know more about animation?

Breakdown of Frame-by-Frame Animation
In this short frame-by-frame animation tutorial, I’ll show you how to create and animate an illustration from scratch. We’ll start with a sketch and will go all the way up to post-production. To do this you’ll only need Photoshop for drawing and for frame-by-frame animation and After Effects to put it all together nicely and […]
Exponential scale in After Effects
How often you want to achieve the exponential scale. You’ve probably tried to do that with graph editor, but it’s almost impossible. In that case, we’ve prepared the two ways how to do it quickly.Right-click on selected keyframes, go to keyframe assistant, and choose an exponential scale. That’s it!Another way is to use the expressionWhich […]
Running Chair Animation Breakdown in After Effects
New “How to” create a funny chair run cycle in After Effects.Step-by-Step Guide: Runnning Chair AnimationThe Running Chair Animation in After Effects is a creative and dynamic effect that can add visual interest and energy to your projects. It involves animating a chair to simulate movement as if it is running or sliding across the […]